- Word count: 2251
- Average reading time: 11 minutes and 15 seconds (based on 200 WPM)
When
December 2016- Current (though halted)
What
In a stereo audio set-up the human ears are able to hear the source of the sound on a plane. But with a 26.1 (pdf) set-up there is a sphere of speakers around the listener. This project encodes a multi-channel wave file for replay on soundcards that support the amount of encoded channels, enabling a similar set-up as linked in the PDF, with more or less channels.
There are a couple things to note about this project before heading on though...
- A true 3d sound set-up like the auromax 26.1 is prohibitively expensive, not only for the soundcards but also for the required amount of speakers and amplifiers.
- Encoding will become troublesome in real-time as latency quickly becomes a blocking issue
- The code is still a work in progress so there naturally will be room for optimization and
With this in mind it's more of a fun gimmick.
Note: the videos are best viewed when able to hear a clear difference between the Left and Right channel. For example with a set of stereo headphones.
Why
This originally started out as a goofy project (and honestly still is, though it has grown significantly since) to experiment with the sound libraries available in Python. But also to be able to actually pan the sound on a given time interval. Although at the moment I don't posses a sound card that is able to playback more than 2 channels, I will in the near future. As long as the soundcard supports ASIO drivers this project will (likely) work.
Why not OpenAL?
OpenAL is a widely used 3D audio librarry written in C. Being written in C enables it to be blazingly fast, but also makes it a bit trickier to work with. Having no experience with OpenAL I wasn't planning on learning a new API in combination with a new language - I wanted to write something myself and be able to add functionality along the way. Additionally I wanted to have results quickly and without a hassle. Knowing Python fairly well at this point I was confident I would be able to code my idea myself. I learned a great lot along the way and in the end I think that is the most valuable part of this project.
How
Get a 3D environment
First thing I wanted to do was to get a 3d plot so I would be able to verify my functions were running properly. Generating such a plot was very easy in matplotlib, but I also wanted it to respond to key feedback. This required the plot to be an animation instead of a static drawing which complicated things. My inkling that matplotlib was not the best library for this purpose was soon clear. However, having quite some experience with this library I decided to move forward - this was for quick prototyping only.
What actually happens in the playback of the animation, is that a new animation is generated for every frame. Although the animation looks like I desired, it does not allow me to safe the animation into a video. This is due to the fact that instead of drawing each frame real-time, a complete one-frame animation is generated and shown. For the below video I have screen capped a short demo which shows a couple of things:
- The center dot is the listener
- The RGB dots on the XYZ-axis represent the channels. In this case only the green dots are active - the channels.
- The moving dot is the 'origin' of the sound - the sounddot.
- The lines drawn from the moving dot to the channel dots are inversely related to the amplitude of the output signal of the soundtrack.
With the the sounddot it is better to manipulate the movement of the dot in spherical coordinats, rather than cartesian. However, the plotting is done with cartesian coordinates, meaning that for every iteration the coordinates are transformed into polar, the adjustments are made, and converted back to cartesian. Setting this up was easy but for the sake of completeness the formulas for conversion look as follows:
From cartesian to spherical:
and from spherical to cartesian:
With the coordinate conversion system in place the 3d environment could be used with key input, e.g. altering an angle or radius at a given time rate. For the distance between the sounddot (\(D\)) with respect to a channel (\(C\)) the distance was calculated using \(r = \sqrt{(D_x - C_x)^2 + (D_y - C_y)^2 + (D_z - C_z)^2}\). With some variables exposed the environment could be used to set-up relations with a sound altering function, e.g. a distance-amplitude relationship. Because the coordinates are converted back and forth it is possible to give input in cartesian and spherical coordinates.
Initially, I was bit worried that due real-time audio processing I would encounter difficulties with the speed of rendering: thinking my pc couldn't refresh the animation fast enough to keep up with the required amount of audio samples (if no sample is provided an error is raised by the soundddevice lib). This wasn't the case as I kept the sounddevice callback function non-blocking and put it its own class. In this class I could freely add attributes as I wished and play around with the signal - linking it with some environment properties like the azimuth and inclination angles.
Understand the signal
As in the above video the function was initially just an example to get it up and running and to demonstrate for myself that what I had in mind would work. My next goal was to understand what kind of data actually went through. Adjusting the volume and recognizing the channels was trivial as the volume is simly multiplying the input with a number, recognizing the channels was just as trivial as the data goes through it as an array of size: \(N * blocksize\). Though understanding how to generate a sign tone for example was a bit trickier. Just hanging a sine function in it didn't cut - so I googled around and came across this blog in which some sine tone generator fuctions were written. I read and studied the code and wrote them in a more readable and friendly way - that blog post goal was not to demonstrate user-friendliness but, rather, abuse of the library itertools, which was pretty cool, to say the least.
Having created a signal I wanted to be able to view the datastream as an animation and plotting this went pretty smooth. In the video below you can see the respective channel output plotted but on top of that I wanted to see if the generated sine was pure and the implementation correct. Below are three videos to show how the plots & the representation of the fourier transformed signal is. I need to comment that the fourier transformed signal is not optimal as this is something I am still working on. Despite that, it does come close to a correct representation. Note that the low framerate is in the representation. The animation becomes increasingly slower when more animations are added.
Mic input:
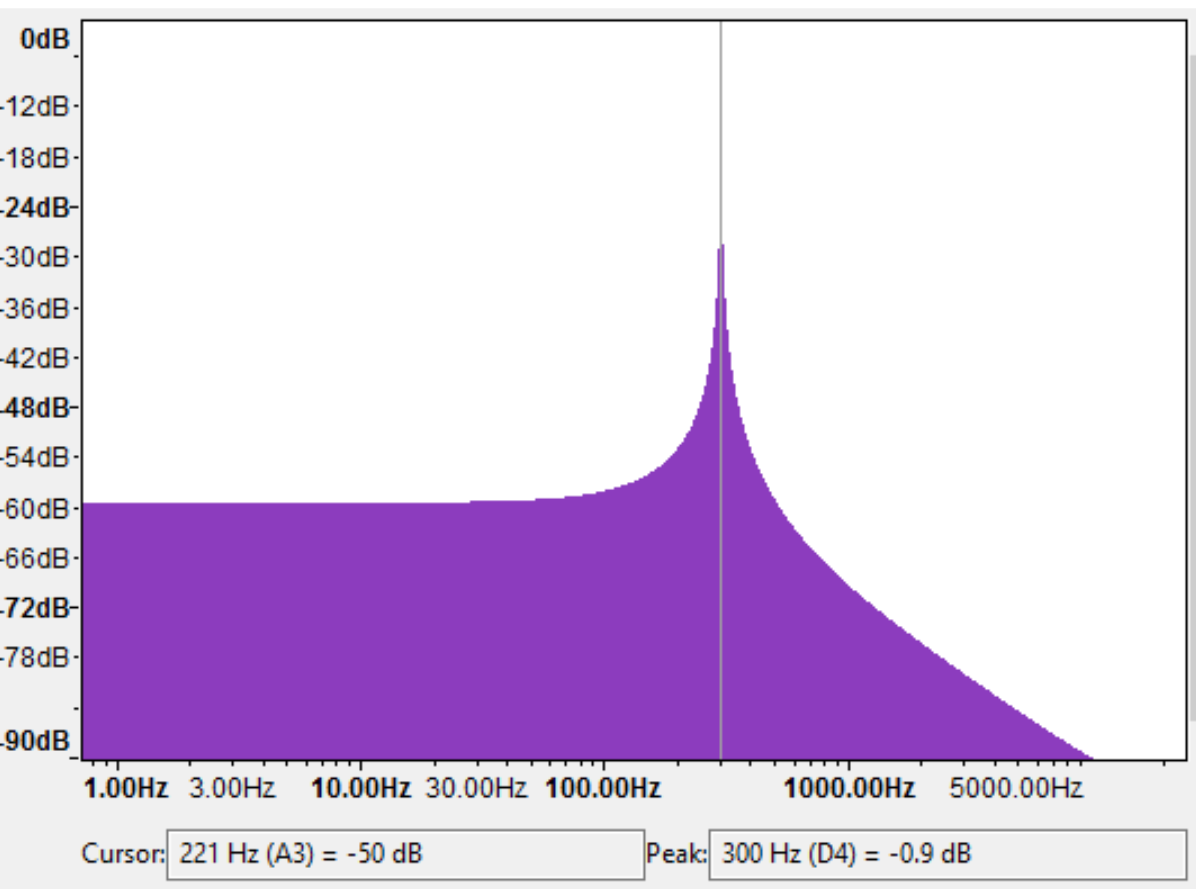
Sine tone (300 hz):
An audio file played back:
To verify that the generated Sine tone is indeed 300Hz, I opened up the saved audio file in Audacity and ran it through the spectrum analysis tool. The analysis demonstrates that the generated sine tone is indeed a pure tone of 300Hz:
Having gained a rough understanding of what the signal consisted of, I wanted to clean up the code base and write it in a more coherent way. Because at this point the code started to look like a jumbled mess of spaghetti.
Bringing structure to the code.
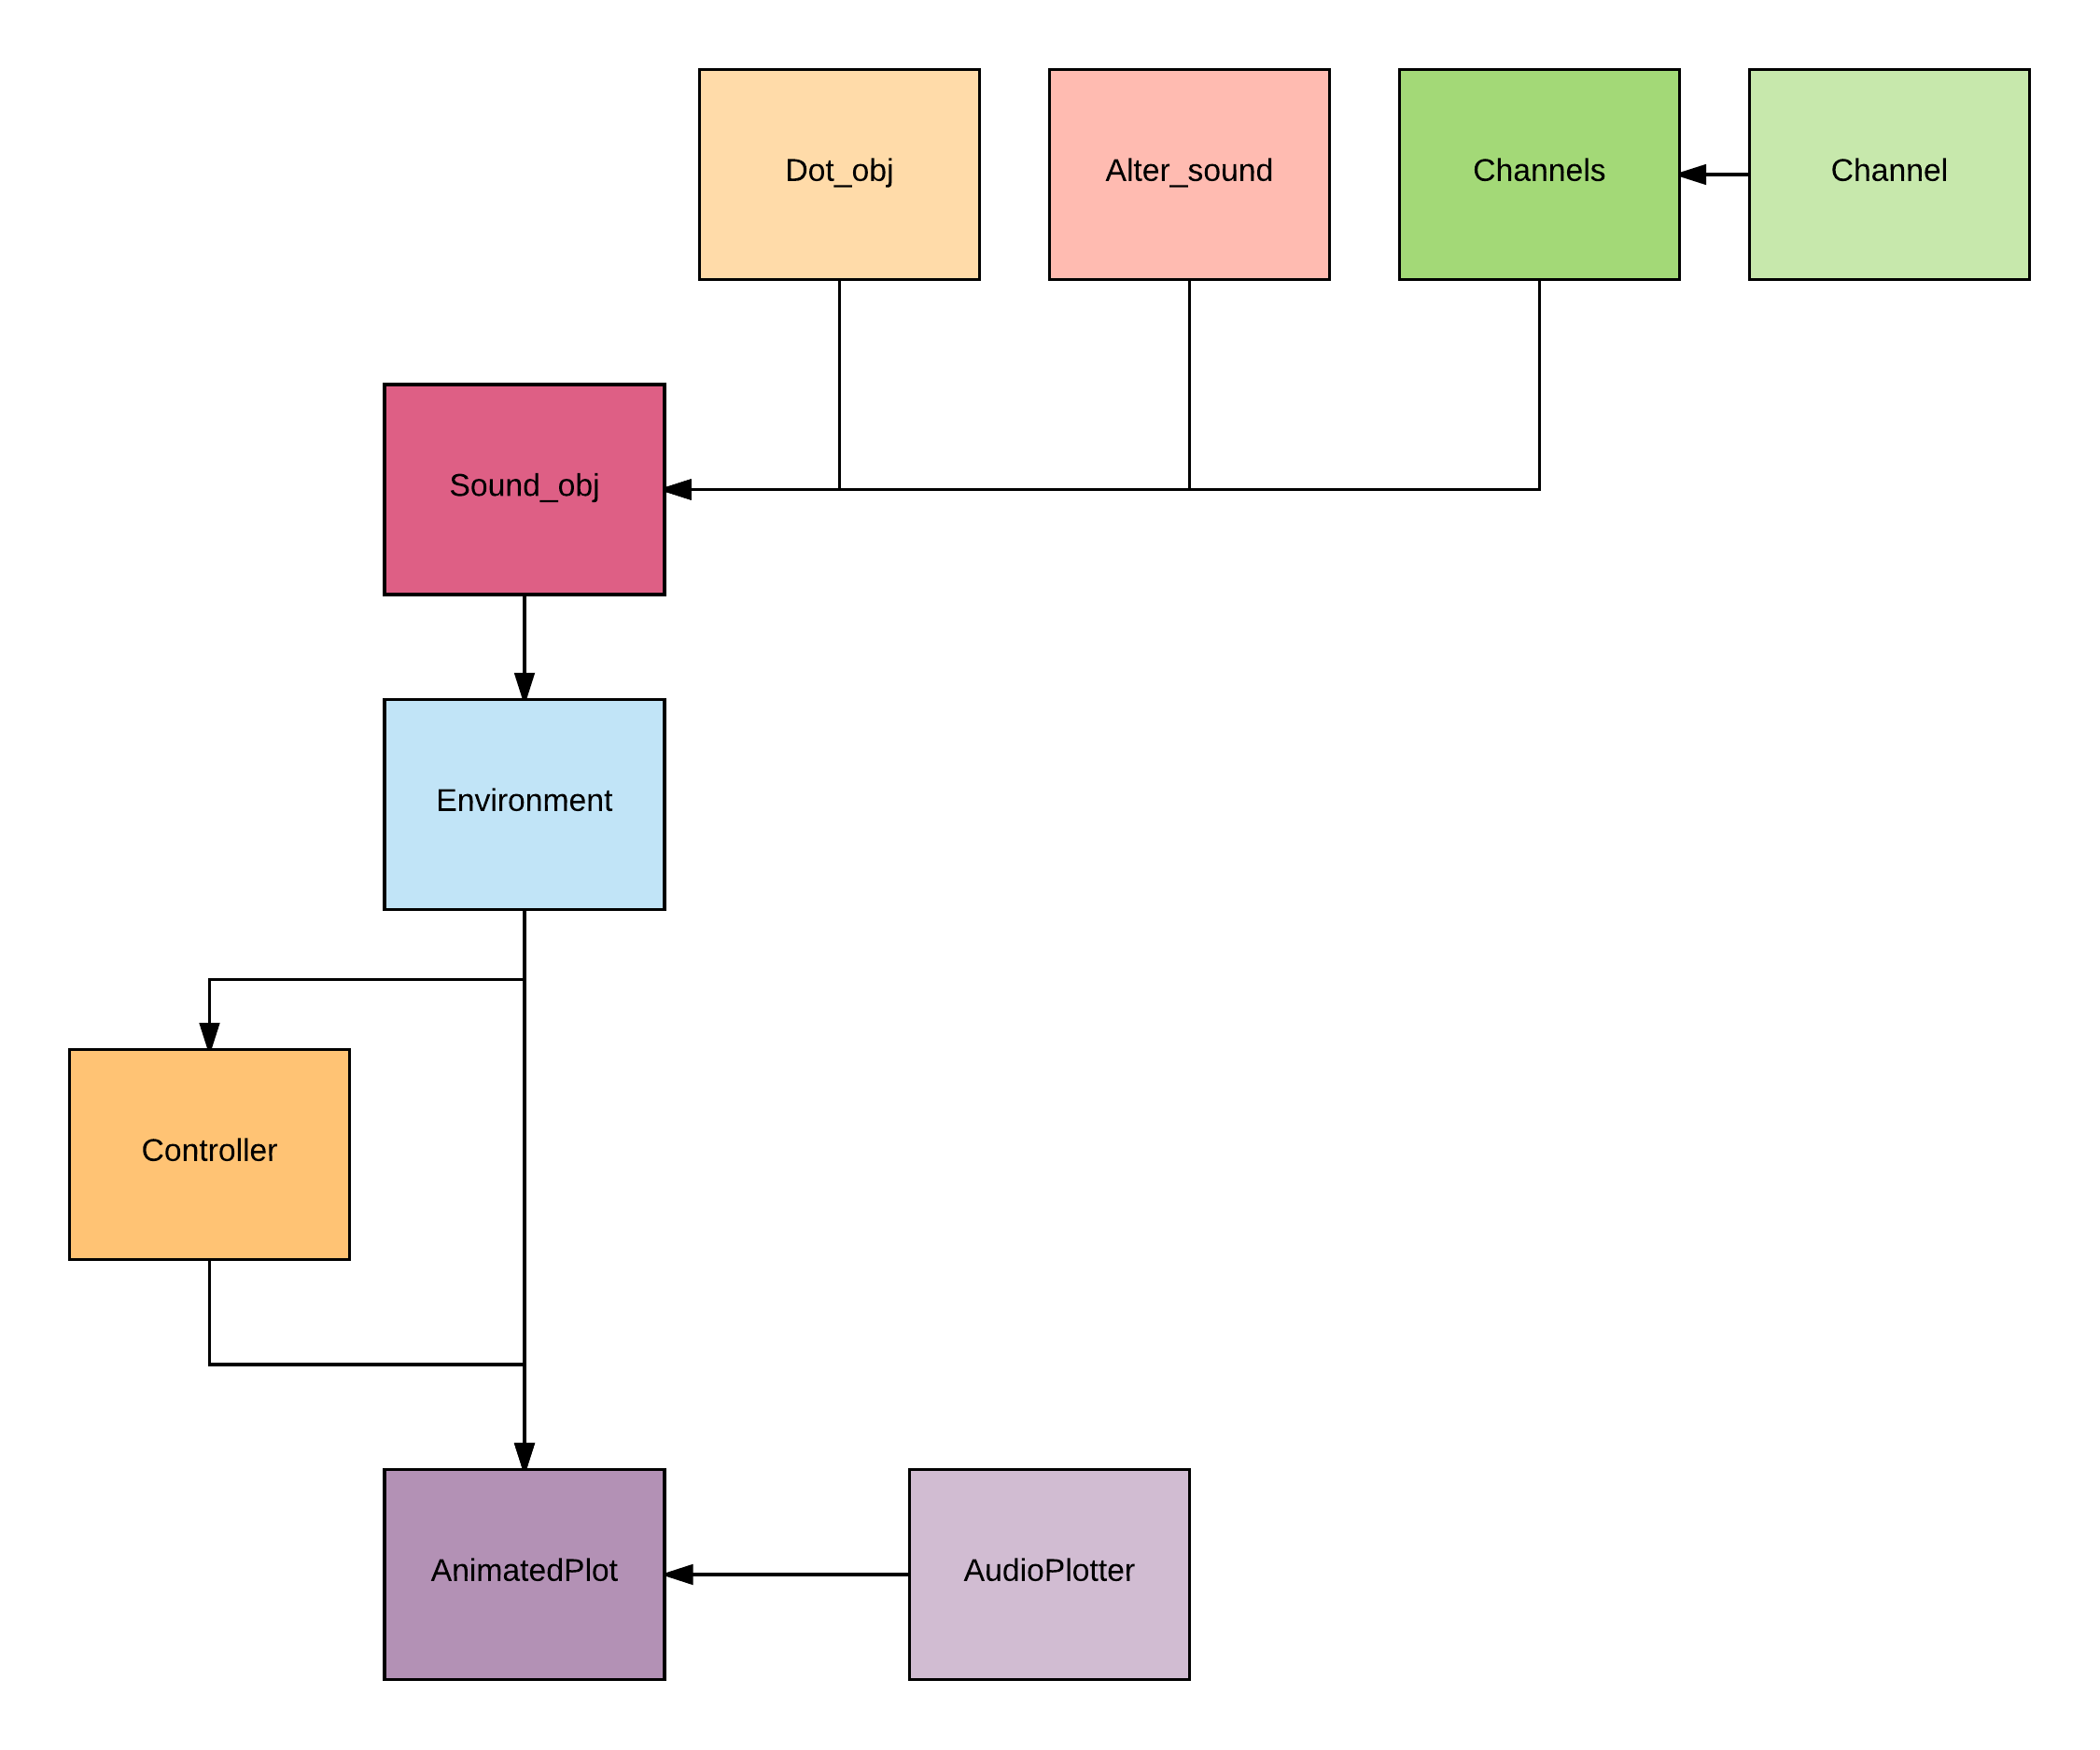
With the need of cleaning and restructering I came up with a useful and clean structure that exposes enough options for later revisions without losing overview. I noticed during development I often lost track of what went were and what was dependend on what - I learned a valuable lesson from my initial self-build crawler and started noticing those lessons were yielding their fruits. Though I must add I feel it can still be improved on the structural level. I have constructed the following diagram. In this diagram there are 2 differences illustrating that the class is initialized inside the class or that the reference of an initialized object is used as an argument to initialize another class. The rules of the diagram:
- If an initialized class is used as an argument it comes from above.
- If a class is initialized within another class it comes from the side.
The class structure:
What I find even more interesting is the way the audio data flows through the project and how the exposed environment can be used with a lot of liberty. The below diagram ellucidates what I mean with the data flow. The audio data is produced in the Sound Object - being either an input file or a real-time recording of the microphone. From there on the audio stream is provided to the Alter_sound class which is structurally almost identical to the Channel class. The reason these are seperate is, that I thought it might come in handy in the future to have the possibility to alter the audio stream before it gets edited on a single channel level / global channel level.
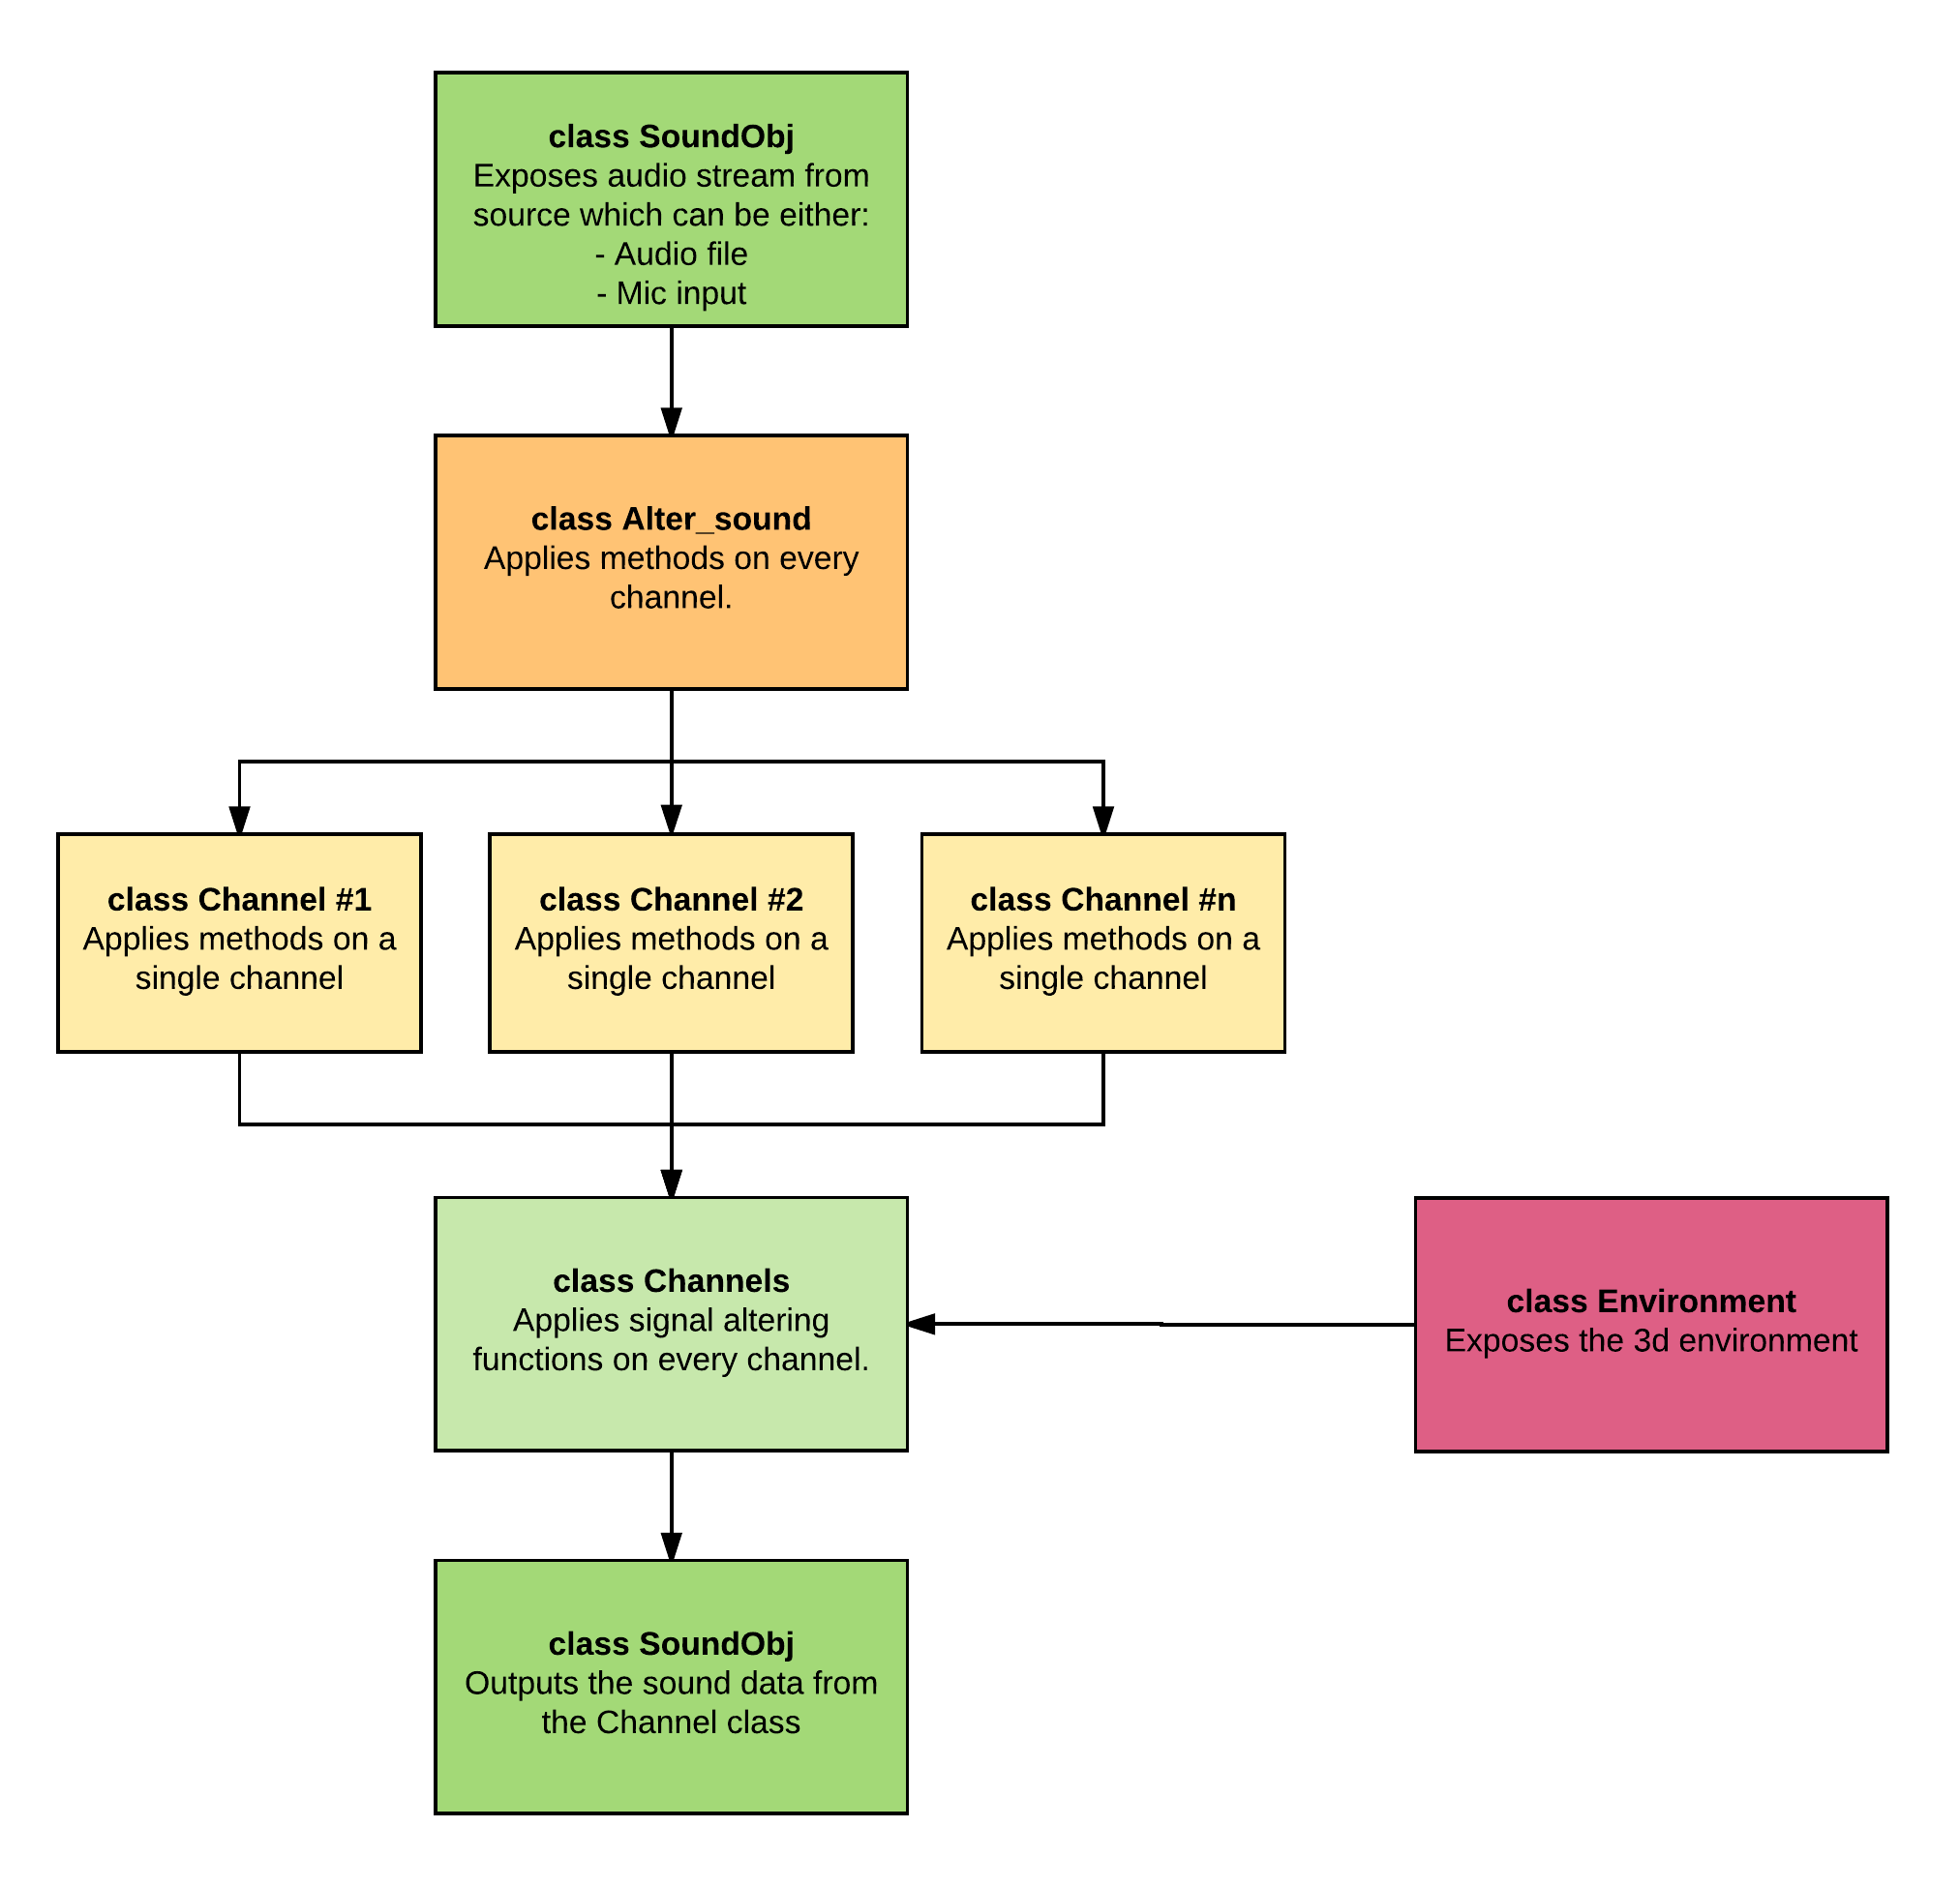
Having passed through the Alter_sound class it is then passed on the Channels class which iterates over every channel with their respective function pipeline before altering the audio stream one last time on a global scale. Being able to manipule the channels seperately allows for some fun toying around with seperate filters - there are a lot of possibilties. The function pipeline is an idea I got from the way Scrapy provides layered functionality. An example:
self.function_filter_pipeline =  {100: self.__modulo_filter_func,
                                  110: self.__gen_sine_tone,
                                  120: self.__set_parts_to_zero,
                                  200: self.__filler_func}
The above function pipeline is a snippet from the Alter_sound class and shows how one can hang in their self-written audio function and in what order they are executed, it is also present in the Channels & Channel classes. Every function in the pipeline only has a datatream as input and outputs an altered datastream for the next function.
Exposing the 3d environment
With all these functions ready to play with the signal, I wanted to make sure I wouldn't miss out on anything so almost every value that is computed is kept as a property of the Dot Object, the implications of this are great as it means that: Every single dynamic line drawn or relation can be linked with a given signal input. For example in the above videos I have only linked the distance between the sounddot and the respective channel with the channel's output amplitude but it goes much further.
to give a brief list of some of the environment variables that are exposed:
- cartesian \((x, y, z)\) coordinates as viewed from the listener AND from every channel
- spherical \((r, \theta, \phi)\) coordinates relative from the listener AND from every channel
- speed of the moving dot in spherical coordinates (e.g. \(+10 \theta\) for every frame OR time-interval)
- distance between the channels and the sounddot.
- and more.
Concluding
This project initially started out as an experiment but soon took on much bigger proportions. With that in mind I have learned an immense amount of valuable lessons about the intricacies of threading, events, exposure, scope, signal processing and the involved libraries. To finish off I wish to leave you a small proof of concept with almost every build-in functionality used. Be warned though that it does not sound good at all. It's just to show what can be done. Enjoy:
For this sample I have done the following:
- Use this audio sample as initial source
- Multiplied a sine tone (300hz) amplitude with the z-axis value of the sounddot and added it to the original source data.
- On the left channel I have put a \(mod(5)\) filter which puts every 5th sample to 0
I hope you enjoyed the read, I sure did making the project and writing it down.
Future
Having written approximately what I originally intended it still requires a half days of work to support a variable amount of channels. At the moment I don't have the resources to build a set-up required to appreciate the program in its entirety but, then again, barely anyone has. The wave file that is encoded for more than 2 channels is most likely unable to be played back by most media players (if any) so if one desires to write a piece of music with this project, it needs to be played back with this program as well. Because I also have another personal project (the crawler) with plenty of open tasks in the backlog I have decided to spend my limited amount of spare time on that one. This mostly because I don't have a set-up required to fully appreciate this project in the close foreseeable future. However, when I do (or anyone else that thinks this is interesting) I will be picking up the following:
- Figure out what exactly is happening with the sine tone overtones.
- Fix the spectrum analysis plot
- Build a proper spectrogram (the one currently is so bad I didn't want to show it)
- Add phase & delay functionality
- Make the program recognizeable as a playback device so audio generated, in for example Ableton, can be directly played back into the program in real-time. Allowing the program to be a 3d playback interface. *Note regarding point 5.: This might not work with the current state of the program because the latency is too big (Rewrite it in Go?), it simply cannot be done because of not allowing more than 1 selected playback device.