- Word count: 1693
- Average reading time: 8 minutes and 27 seconds (based on 200 WPM)
When
June 2016
What
Intro
ORTEC handed my university a playground assignment for us to solve: How can a delivery company deliver all the packages according to a set of rules with as low cost as possible. Initially the goal was to provide an initial solution from which an optimization algorithm can improve on. The initial solution was to be made by every person in itself and later on in the project, groups would be formed to write the optimization algorithm. The data provided came in Excel and the answer sheet needed to be in Excel as well. The idea was that the assignment was to be programmed in Visual Basic for Applications (VBA). Having experience with VBA but a whole lot more with Python I asked if it was allright if I made the assignment in Python, it was allright.
Provided by ORTEC was an Excel sheet with multiple tabs consisting of:
- A distance matrix, from zip code to zip code
- A travel time matrix, from zip code to zip code
- Location of the origin (Depot)
- A list of the consignments
- The rules.
The rules:
- Every pick-up takes 5 minutes on top of the travel time.
- Every delivery takes 4 minutes on top of the travel time.
- For every consignment sharing the same zip code but not the same adress there was a travel time of 2 minutes.
- For every consignment sharing the same zip code and not the same adress there was no travel time. But if it was a delivery after a pick-up the time spend on top the travel time was 4 + 1 minutes.
- A van can have a maximum load of 1100Kg.
- Loading the cargo at the depot takes 30 minutes - if there are consignments to be loaded.
- Emptying the cargo at the depot takes 15 minutes - if there are consignments to be dropped.
- Start-time is 6:30 - the van can start loading.
- End-time is 18:15 - the van needs to be empty then.
- A van may work at most 10 hours on a day.
- Van cost per km is 0.20
- Van cost per hour is 15.00
- Van cost a day is 20.00
- All vans are identical
- There are infinite vans
- The vans have infinite range
- The consignment must arrive within the provided time interval. The time it takes to make a delivery / pick-up is excluded.
The challenge was to deliver all consignments with as low cost as possible. A consignment looks as follows:
| Type of delivery (C = pick-up and D = delivery) | OrderNr | Adress | Zip Code | X coordinate | Y coordinate | Landcode | Datum | Begin of arrival time | End of arrival time | Weight | Depot |
|---|---|---|---|---|---|---|---|---|---|---|---|
| C | 129385 | Dam Square | 1012 NP | 52.373095 | 4.8909072 | 31 | 09/04/2015 | 13:00 | 16:00 | 7 | ARH |
How
Plotting the data.
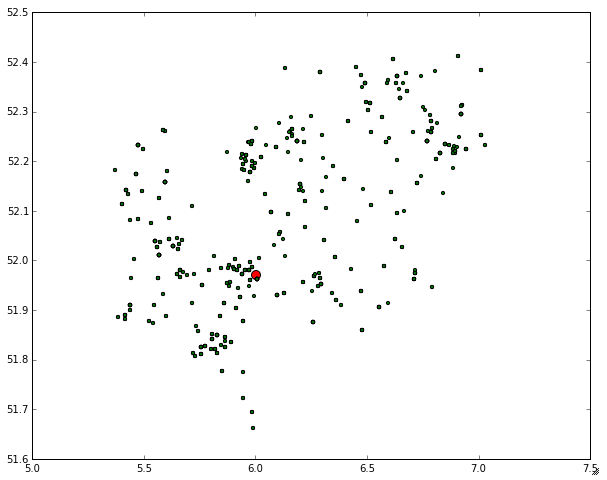
With all the data & rules needed to solve this challenge I set out to plot the data. Because the most relevant part of the consignment is the zip code and not so much the physical location I clustered the consignments belonging to a specific zip code and calculated the centroid of that zip code. Below is a scatter plot of the 256 centroids.
While this gives a good first impression of how the consignments are distributed it is more valuable to view them with a size appropriate to the amount of consignments belonging to a specific zip code. Below is a plot of the same scatter plot as above but now with the dots reflecting the amount of consignments present in that specific zip code.
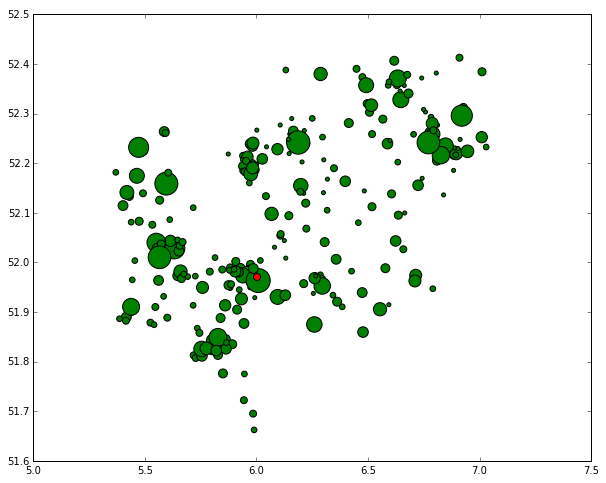
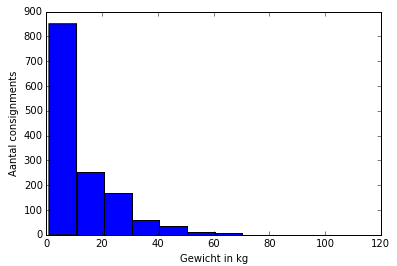
This already gives a far better impression of how the consignments are distributed along the map. Additionally I wanted to see the distribution of package weights so a simple histogram sufficed:
Aside from these plots I've plotted a lot of other different statistics but didn't want to clutter this post with an overkill amount of plots. Some other statistics I plotted for inspection were:
- Distribution of begin arrival times & end arrival times and the total time interval.
- Amount of Pick-ups and deliverys per zip code.
- Time distribution boxplot per zip code
Generating an initial solution
As per the assignment the idea was to generate an initial solution which was to be optimized later on in the project. But before I could work with the data I needed to extract it from the excel sheets and get them into a workable format for Python. With the pandas library I was able to easily get all the data from the excel sheet loaded into Python.
Getting the required dataframes
With the data in a python structure I needed to construct some dataframes that would speed up the process and made working with the data easier. With the distance and travel time arrays one could calculate the cost of getting from A to B. I didn't actually need the distance array during the calculation as the vans had infnite range. The only reason for the distance array to be present is to calculate the inferred cost. I merged the distance array and travel time array in a single cost array which would later be used to calculate the inferred cost.
Additionally I wanted to speed up the look-up times for quicker decision making so I made a nested dict to nest them from top to bottom: Zip code --> Adress --> Consignment. Translating into a depth-first approach. With the necessary dataframes in place I needed to choose an algorithm to provide an initial solution.
The algorithm
The algorithm used for this task is a greedy Nearest-Neighboor (NN) search. Whenever the van is at a consignment it will go to the cheapest available consignment, with respect to the set-out rules. This process repeats itself till the van is either full or no consignments are left to deliver / pick-up. This greedy algorithm has a couple of advantages and disadvantages. With the largest advantage being that it's incredibly easy to implement.
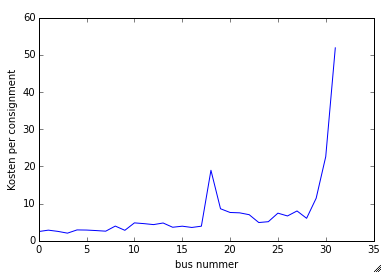
In the plot below you can see the progress of the vans. The plot represents the average cost per consignment per van. With the van numbers on the x-axis and the average consignment cost on the y-axis it illustrates nicely the progress of a typical greedy algorithm. One thing to note is the peak occuring at the 17th van. This is due to the time constrained. The van always starts as early as possible as did Van 17. However, there were very little nearby early consignments left to deliver at this point - it waited till the next consignment was available again. The next Van started much later on the day as not to waste money on waiting, though the set day rate still increased the overall price. At the bottom of this post you can view the entire progression of the algorithm plotted out on the map.
With the algorithm in place and working I decided I needed to structure the code for the final part of the project, optimizing the intial solution. Because I probably had the most programming experience of the group I set out to make a pipeline that we could adjust relatively easily and we could focus more on getting an optimal solution and less on trying to hack something together.
The pipeline
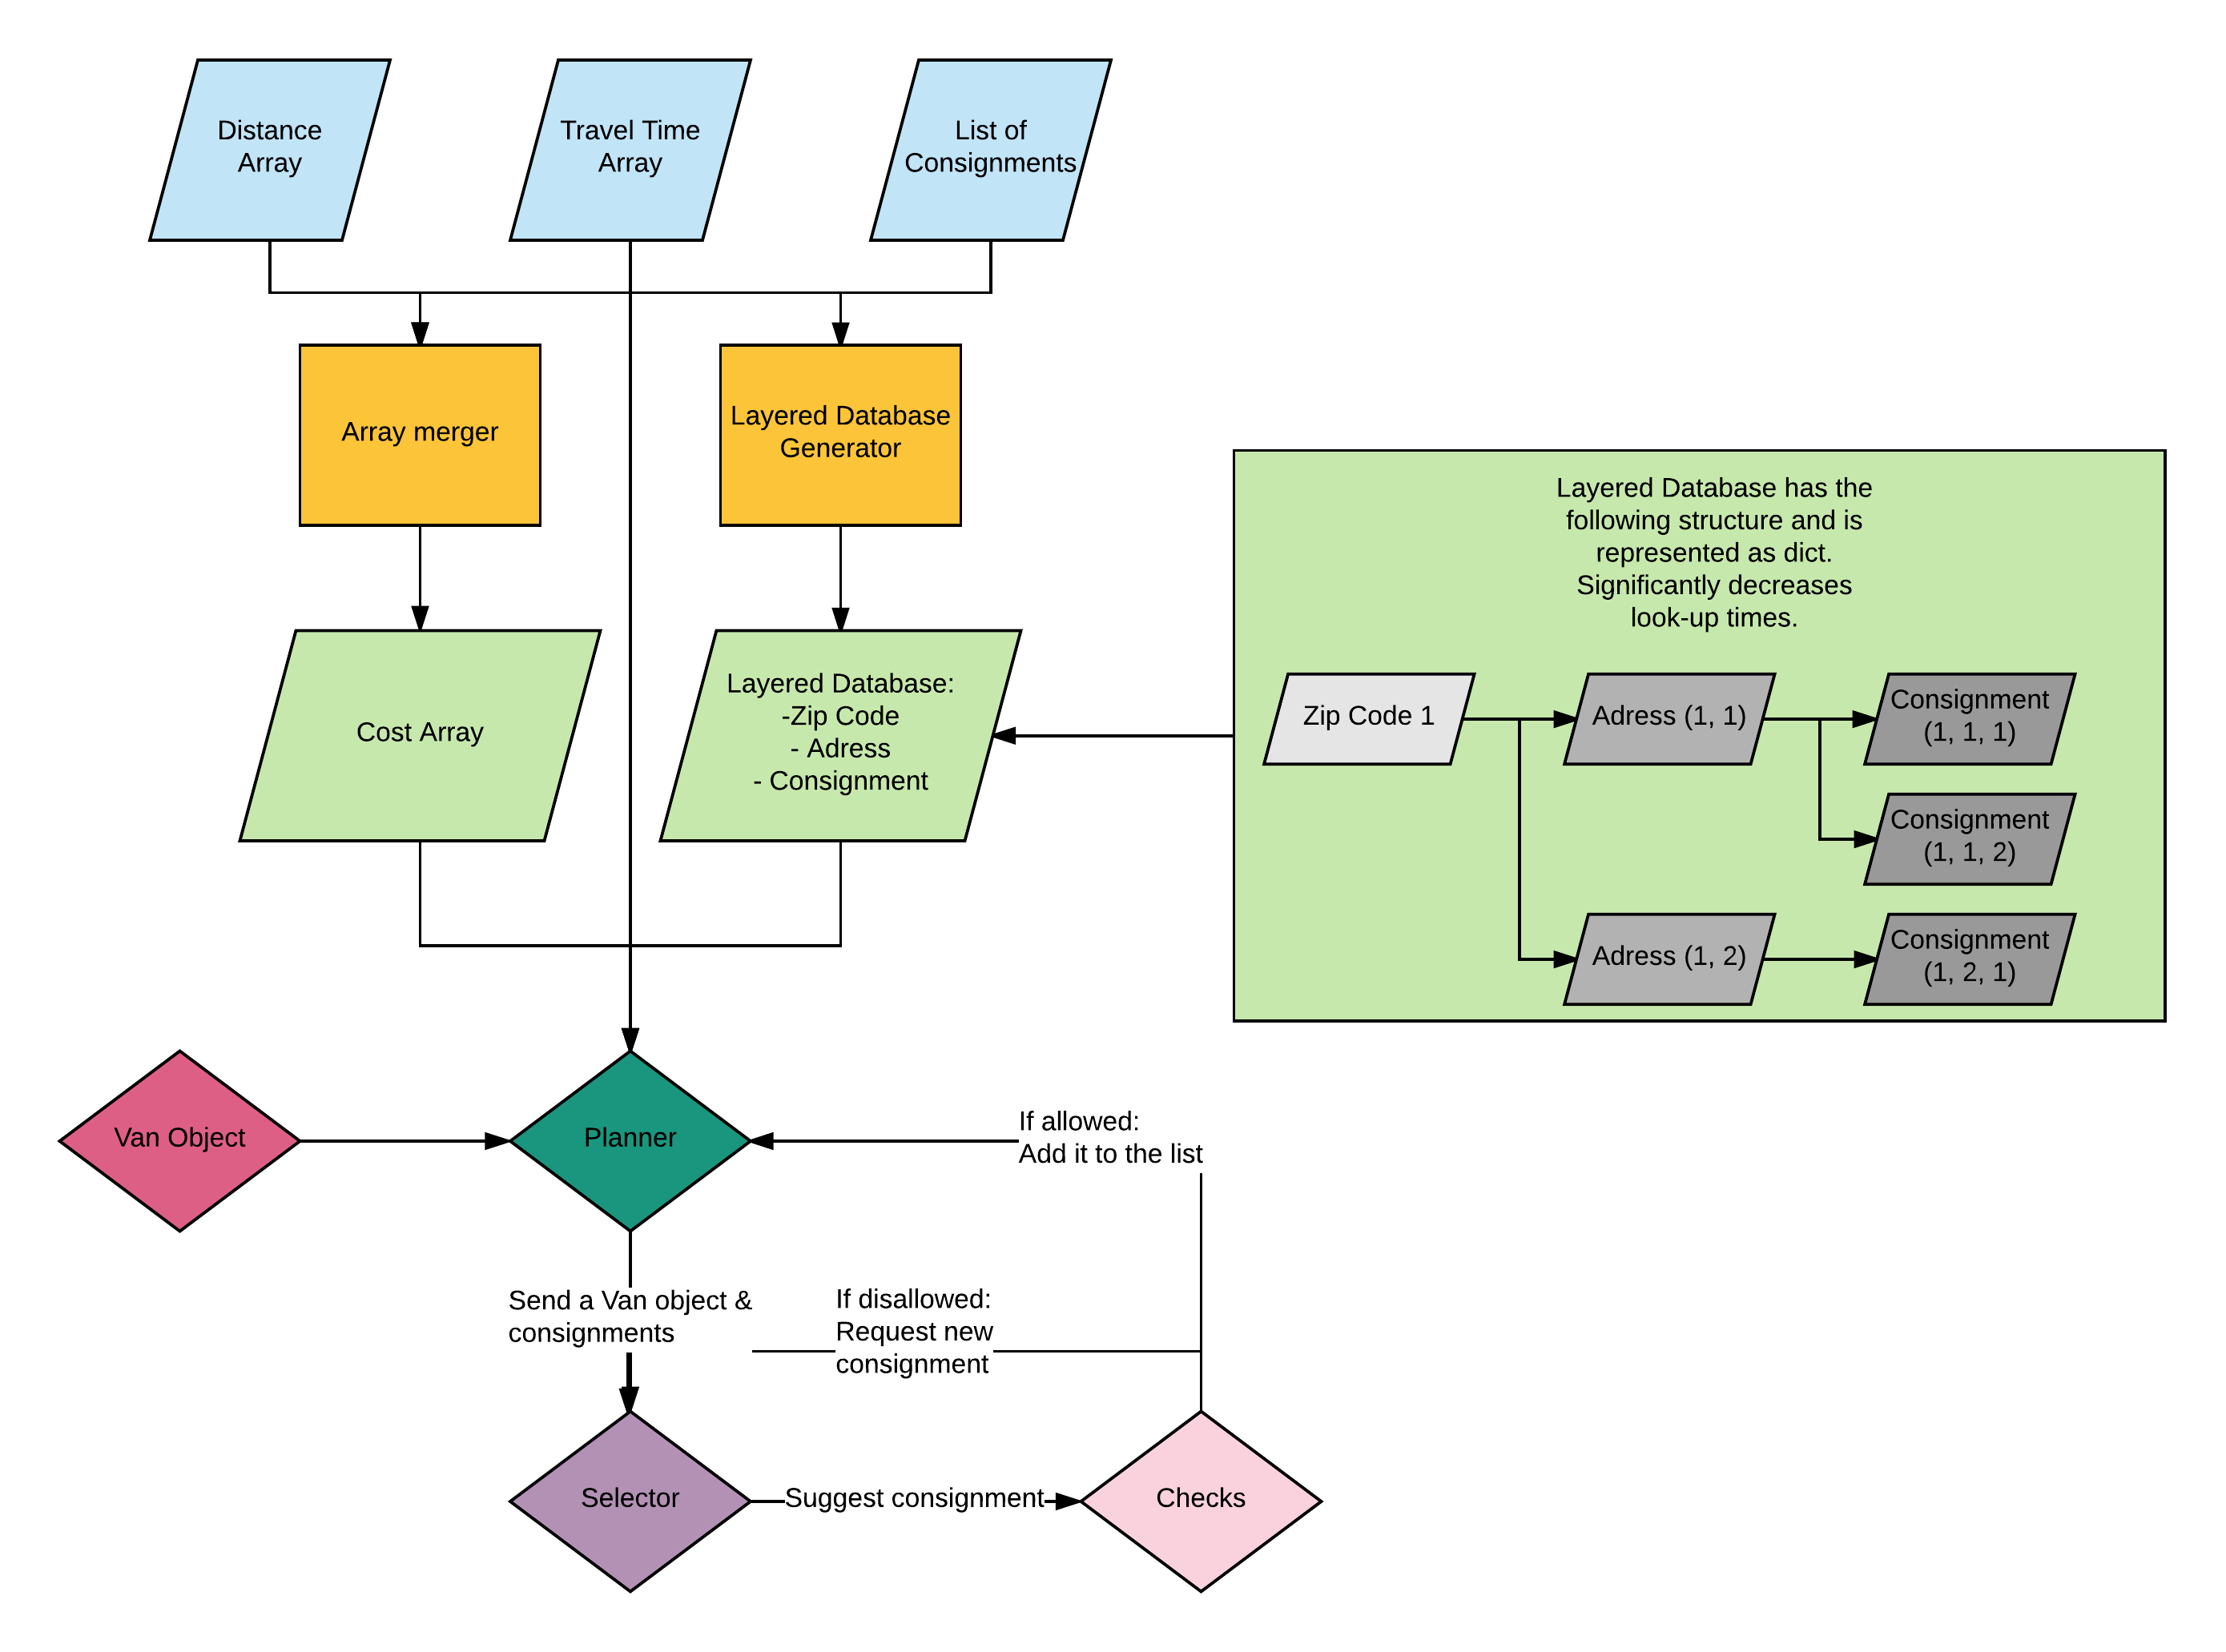
In the above image the entire pipeline of the code is illustrated. First the arrays are loaded in from the excel sheet and are passed on to Array builder class which constructs the Cost Array and the nested dictionary. When done, these are are forwarded to the Planner class - the main loop. Additionally the Van object is passed as an argument to the Planner class. At first a Van object is initialized and gets passed to the Selector class which runs through the available consignments.
It is the Selector class that holds the algorithm and for further optimization only this class needs to be altered - I figured this would be the the piece of code for our project group to actually try working out different methods and varying optimization techniques, so in some sense it's a simple API for optimization. As long as the output stays the same format it'll work.
With the Selector class having selected a candidate consignment it is passed through the Check class, which verifies if the consignment is allowed to be delivered / picked-up by the provideed Van. If not, it'll be dropped from the list of candidates for this given iteration for this given Van and the next consignment is selected to go through the process again. This repeats itself till the Van is full or there are no more consignments to deliver.
Having coded this in almost the first week of the project I was done with the initial assignment rather quickly and only needed to wait till the final phase of the project, this time I spend on reading into possible algorithms to use for further optimization. Close to the end of the first phase deadline a serious event happened at my university which forced the tutors to drop the second phase of the project leaving the students only with the assignment to provide an intial solution. Having other projects on the side I wanted to spend my time on I decided to leave it for what it is and wrote down my solution to hand it in.
The solution
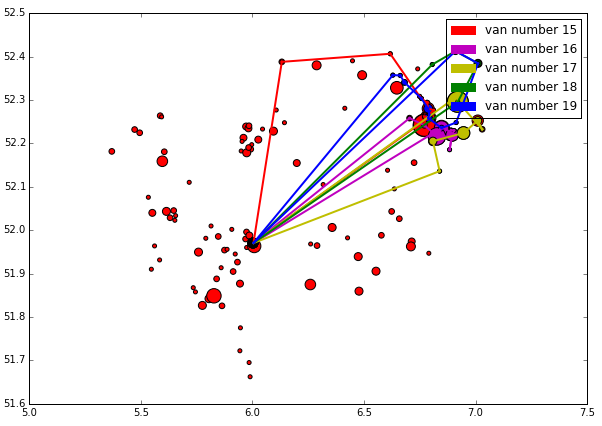
The solution was exactly what one'd expect from a greedy algorithm. It performed excellent in the beginning but after hitting the time constrained it started to make longer passes. Furthermore, towards the final end it had a very narrow time interval to work with thus the last Van actually only handles 2 consignments lying quite far apart from each other, which made it pretty costly.
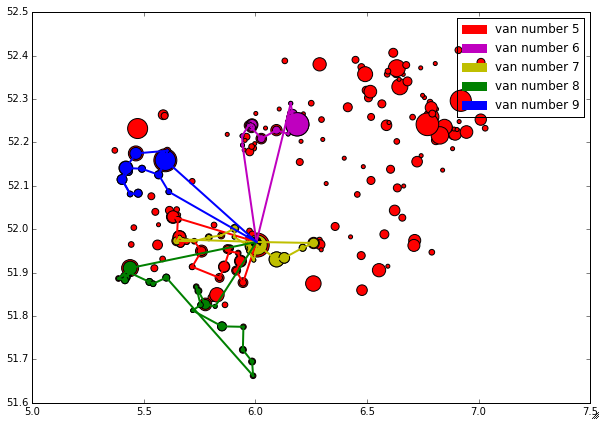
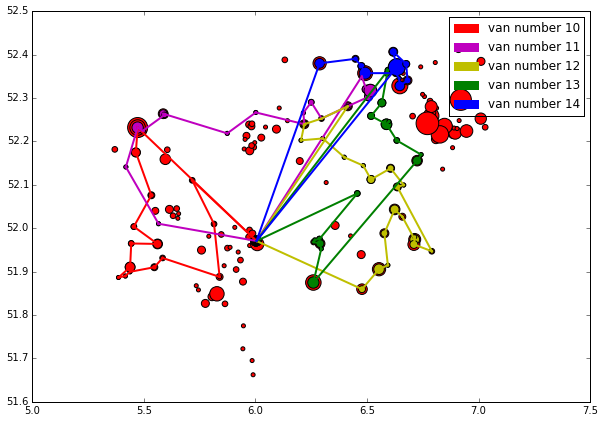
As was the case in the size related centroid scatter plot; the sizes of the dots reflect the amount of consignments to be done in the respective zip code, the size of a colored dot illustrates how many consignments a Van handles in that particular zip code. Enjoy:
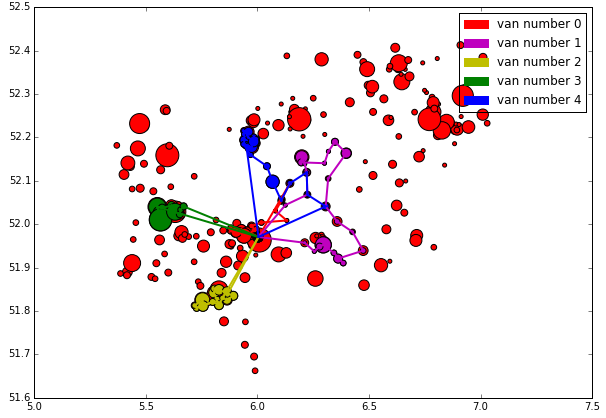
Great performance
Still going great
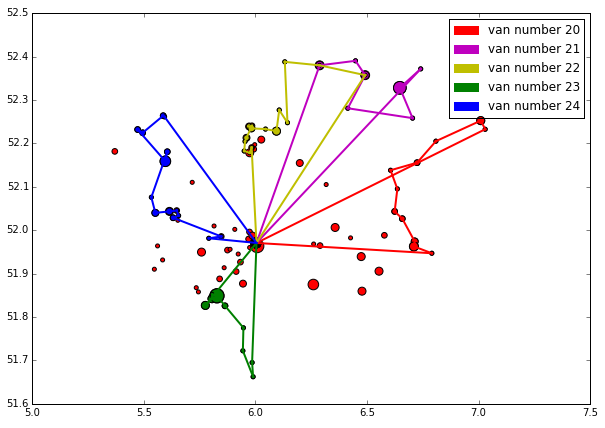
Taking longing tours already
And growing
Running out of cheap options now
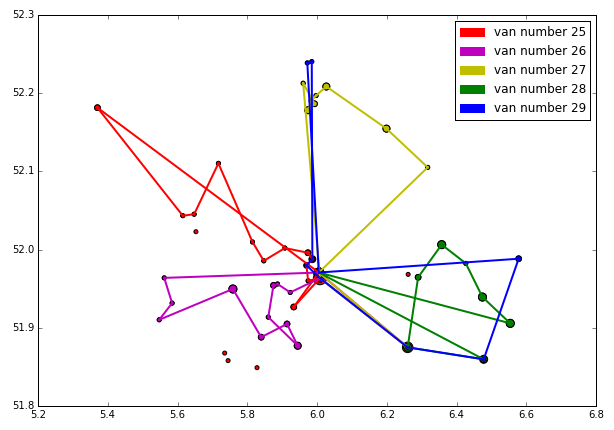
Starting to get really expensive
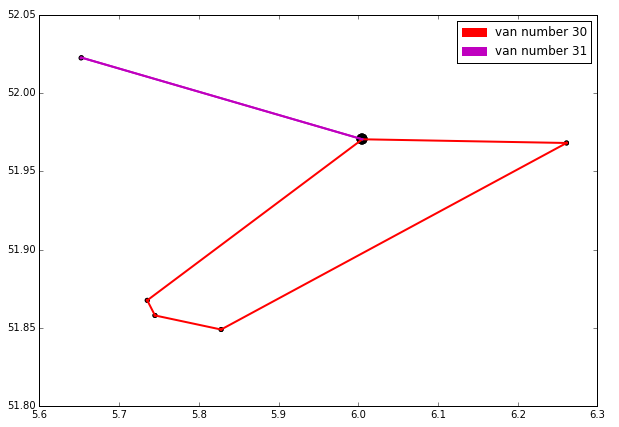
really, really expensive.